How to view feedback by question
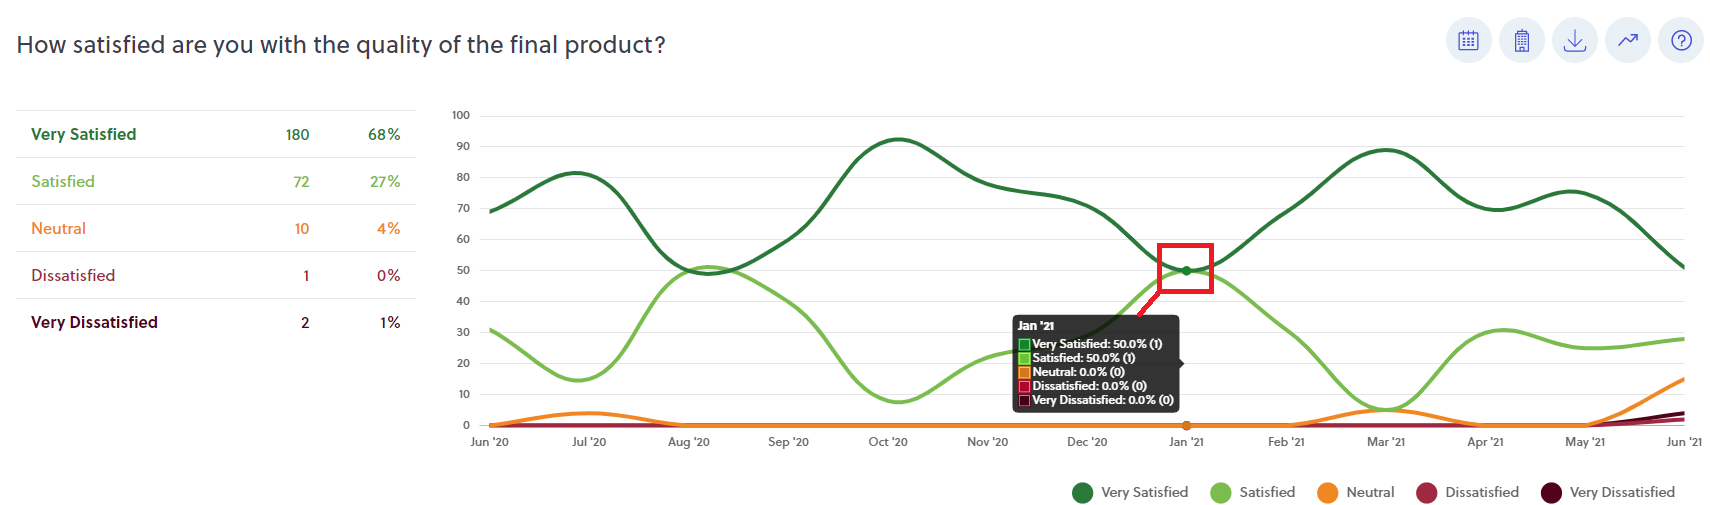
The Feedback By Question section provides feedback data on each question in your survey. This page has two sections. Summary widgets of stats along the top, and a chart for each question. Each question (chart) displays a summary table of overall responses on the left, and displays a graph of your overall responses overtime. Hover over the line on your chart to view the data for that point in time.
Steps:
- Click the Feedback Icon (rotating arrows) on the Dashboard Sidebar
- Select the "By Question" tab along the top of the page
- Summary Widgets of Stats (top)
- Chart for each Question - 5 button icon options for customer data
- Change Date Range - Allows you to change data timeframe (Default: 6 months)
- Change Location - Select data by location
- Download as CSV - Download your customer data
- Chart/Table selector - Select your data view by time chart, bar chart, or table
- Help Video - Open our short help video on managing this page